Page 252 - SpringBoard_ELA_Grade7_Flipbook
P. 252
visual Impact
aCTIvITy 3.19
Learning Targets
• Analyze the ideas and details in photos, posters, charts, tables, graphs, and a timeline to clarify understanding of the topic of Nelson Mandela and apartheid.
• Create visuals that represent research about apartheid and Nelson Mandela.
Preview
In this activity, you will read and interpret graphics and a timeline and think about my Notes how information can be presented visually.
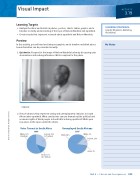
1. Quickwrite: Respond to the image of Nelson Mandela below by discussing your observations and making inferences. Write a caption for the photo.
Caption:
2. The pie charts below represent voting and unemployment statistics in South Africa under apartheid. What conclusions can you draw about the political and economic rights of black people in South Africa during apartheid? Write your responses in the space under the charts.
Voter Turnout in South Africa
Unemployed South Africans
1989
1987
White, 57% (3 million)
Colored, 31% (1.7 million)
Asian, 12% (0.7 million)
Black, 82%
White, 2% Colored, 13%
Asian, 3%
Unit 3 • Choices and Consequences 225
LearNING STraTeGIeS:
Graphic Organizer, Outlining, Visualizing
© 2017 College Board. All rights reserved.