Page 229 - SpringBoard_ELA_Grade6_Flipbook
P. 229
aCTIvITy 3.7
continued
a Graphic Is Worth a Thousand Words
my Notes
Types of Graphics
• Line graphs show change in quantities over time; for example, the chart on
page 192 is a line graph.
• Bar graphs are generally used to compare quantities within categories.
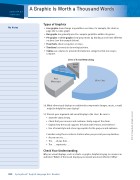
• Pie graphs or circle graphs show proportions by dividing a circle into different sections (see the example below).
• Flowcharts show a sequence or steps.
• Timelines list events in chronological order.
• Tables use columns to present information in categories that are easy to compare.
Uses of Social Networking
Send Upload Mail
Photos
Post Messages
IM or Chat
10. What other visual displays or multimedia components (images, music, sound) might be helpful for your display?
11. Present your argument and visual display to the class. Be sure to
• State the claim clearly.
• Check that your reasons and evidence clearly support the claim.
• Explain how the visual supports the claim with reasons and evidence.
• Use a formal style and a tone appropriate for the purpose and audience.
Consider using these sentence starters when you present your explanation:
• As you can see, . . .
• The . . . shows that . . .
• The . . . represents . . .
Check Your Understanding
Why are visual displays, such as charts or graphs, helpful in trying to convince an audience? Which of the visual displays you viewed was most effective? Why?
202 SpringBoard® English Language Arts Grade 6
© 2017 College Board. All rights reserved.