Page 35 - SpringBoard_ELA_CA_Smapler_Flipbook
P. 35
acTIVITY 3.7 continued Teacher TO Teacher
Share this important point with students: “Supplement, do not supplant, the speech with the visual aid. Do not allow the visual aid to overwhelm the speech itself. Visual aids are not crutches to lean on, but rather lampposts to illuminate.” (“Using Visual Aids.” University of Pittsburgh. August 2012. Web.)
b Have each group present its visual display and explain how it supports the claim.
c Have students individually complete the Check Your Understanding as an exit ticket.
Teacher TO Teacher
Consider the “hot topic” of technology and education by debating a question such as “Should all texts be available on e-readers?” or “Should schools stop buying traditional books in favor of e-readers?”
aCTIvITy 3.7
continued
a Graphic Is Worth a Thousand Words
my Notes
Types of Graphics
• Line graphs show change in quantities over time; for example, the chart on
page 192 is a line graph.
• Bar graphs are generally used to compare quantities within categories.
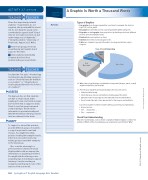
• Pie graphs or circle graphs show proportions by dividing a circle into different sections (see the example below).
• Flowcharts show a sequence or steps.
• Timelines list events in chronological order.
• Tables use columns to present information in categories that are easy to compare.
Uses of Social Networking
Send Upload Mail
Photos
Post Messages
IM or Chat
10. What other visual displays or multimedia components (images, music, sound) might be helpful for your display?
11. Present your argument and visual display to the class. Be sure to
• State the claim clearly.
• Check that your reasons and evidence clearly support the claim.
• Explain how the visual supports the claim with reasons and evidence.
• Use a formal style and a tone appropriate for the purpose and audience.
Consider using these sentence starters when you present your explanation:
• As you can see, . . .
• The . . . shows that . . .
• The . . . represents . . .
Check Your Understanding
Why are visual displays, such as charts or graphs, helpful in trying to convince an audience? Which of the visual displays you viewed was most effective? Why?
aSSeSS
The key look-fors are that students are able to read a visual, make meaning of a text, and create a visual based on the text to support a claim. Check to see that groups can work collaboratively to decide on the information to present visually and that the information directly connects (acts as evidence) to the claim.
aDaPT
To support or extend this practice, provide different groups of students a copy of any visual to read and discuss. You might have them practice reading the example visuals, either in a carousel format or by having groups rotate their examples to the next group.
Also consider returning to a previous text to brainstorm visual displays that could accompany the information or argument presented. You might talk about how you use visual displays in teaching to support learning. Consider creating an example visual display for one of the texts to show as a model.
202 SpringBoard® English Language Arts Grade 6 9781457304620_TCB_LA_SE_L6_U3_P4.indd 202
13/04/15
4:33 P
202 SpringBoard® English Language Arts Grade 6
© 2017 College Board. All rights reserved.
© 2017 College Board. All rights reserved.
M